
Recommended Articles

Gambling practices around the world
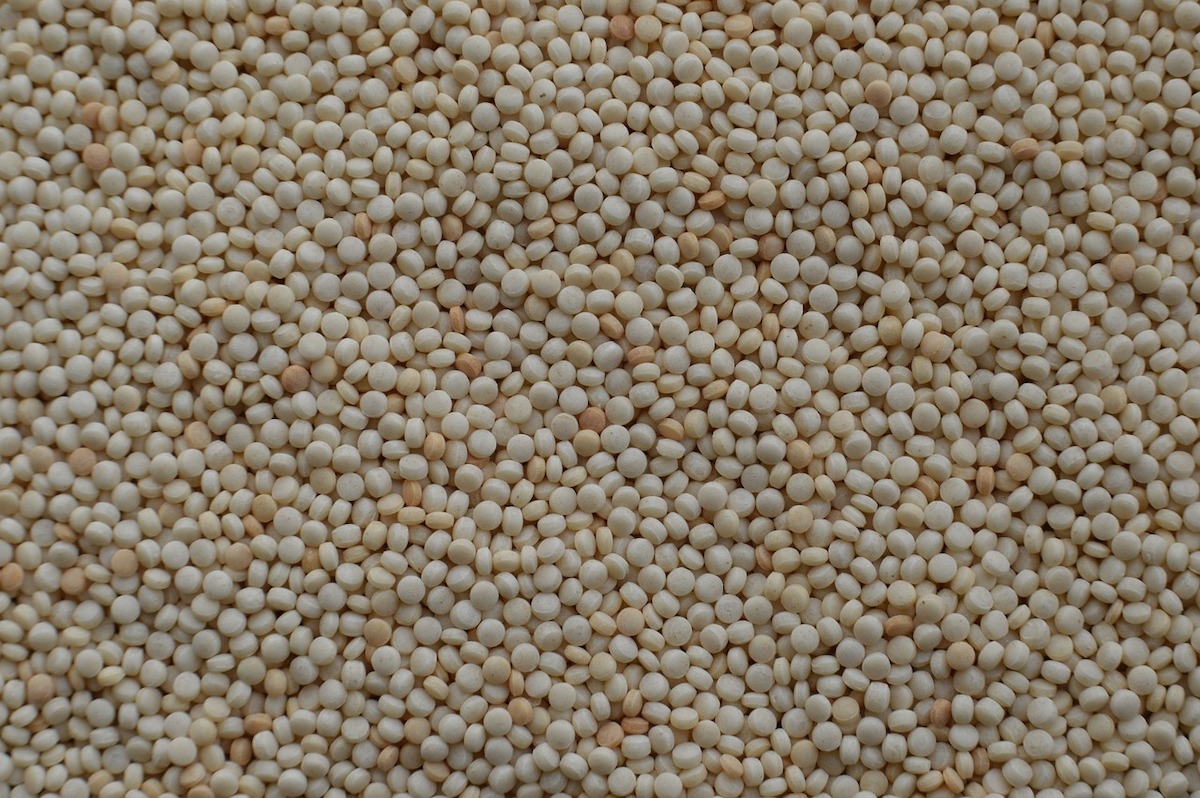
Why and how to eat Pearl Couscous, a Middle East cuisine marvel!

Why Ottawa must take action on mental health